By
By
Sustainability is definitely the buzz word at the moment. But what does it actually mean and more importantly, what does it mean for you as a veterinary professional?
The definition of sustainability, as set out by the Brundtland Commission in 1987:
They defined sustainability as “Meeting the needs of the present without compromising
the ability of future generations to meet their own needs.”
In that context and when thinking about what goes on in the operating theatre we are concerned with practices or procedures that may impact on future generations, and the one that most readily springs to mind is the liberation of volatile agent into the atmosphere. Agents such as Sevoflurane, Isoflurane, and Desflurane have a significant Global Warming Potential (GWP), and environmental lifetimes of 1-5, 3-6 and 9-21 years respectively. Desflurane is undoubtedly the worst of the three and life-cycle greenhouse gas (GHG) emissions with desflurane are 15 times larger than those with sevoflurane and 20 times higher than those with isoflurane [1]. This article does not look to go into the detail of the precise impact of these agents as this material is widely available, but rather looks to see how the veterinary professional in practice can optimally minimise the use of these agents and so improve the sustainability impact as well as reduce costs. Although not so widely used now, it should be pointed out that Nitrous Oxide has a very long lifetime in the atmosphere of 114 years with significant GWP. The following table, taken from the paper by Varughese et al [1] summarises the above.

Although one very good way to reduce volatile agent use is to switch to Total Intravenous Anaesthesia (TIVA), this is not a practical solution for many practices, at least in the short term, due to the very embedded culture of gaseous anaesthesia. Significant time in retraining and development of new skills is required to make this switch, so for now this article will focus on optimising the use of the volatile agents.
All volatile agents are carried in a carrier gas, such as oxygen or a mixture of nitrous oxide and oxygen. These agents leave the patient with over 95% of the agent unchanged and are typically scavenged to reduce local contamination, but subsequently released to the atmosphere without any further processing [2]. There are now emerging technologies that are capturing and recycling the waste anaesthetic volatile agents. SageTech Medical [3] manufacture a system called a Circular Economy Solution that captures available volatile anaesthetic agents (sevoflurane, isoflurane, desflurane) onto a reusable capture canister (SID-Can). The captured waste is then recovered and recycled for future reuse. These systems are now being adopted by the NHS and
private medical hospitals, and in time may find there way into veterinary operating theatres.
In the absence of such capturing devices, volatile agents are essentially lost from the practice once they leave the patient circuit, and so the most effective thing that can be done is to minimise their use during anaesthesia. This applies to non-rebreathing systems as well as circle circuits. The
amount of agent used depends on two factors: the vaporiser setting and the fresh gas flow
(FGF). When considering the amount of agent being used, multiply the FGF by the vaporiser setting to get an idea of the relative amount being used.
Using this method, it can be seen that a FGF of 2L/min and 2% agent uses the same amount of agent as 4L/min and 1% agent. In practice it is difficult to reduce the agent percentage during the course of a procedure, but it can be minimised, for example by using painkillers in the pre-med and/or during the procedure. The main focus therefore is on minimising the FGF. It can be a habit to put all of your cats on 2L/min, medium dogs on 4L/min and big dogs on 6L/min, or to run all circles at 3L/min, but using modern monitoring techniques these flow rates can be significantly reduced if you know how and where to look. This article shows you how.
Anaesthetic circuits can be broken down into two basic types, non-rebreathing and rebreathing circuits. Rebreathing circuits are nearly always circle circuits these days and they are used extensively.
Minimising fresh gas flow rates in circle systems
When anaesthetising a patient using a circle system there are two distinct phases to consider, the
denitrogenation phase and the maintenance phase.
Q: What is the denitrogenation phase?
A: Air contains approximately 21% oxygen and 79% nitrogen, so when a patient is connected to an anaesthetic circuit only 21% of the circuit and the patient’s lungs contain oxygen. Since we run most of our patients on 100% or near-100% oxygen it therefore takes a while to replace the nitrogen in the system with oxygen. This process of replacing the nitrogen with oxygen is called denitrogenation.
It can be shown that for a hypoventilating animal a minimum of 35% oxygen is required to maintain the partial pressure of oxygen in arterial blood at or above 100mmHg [4]. We always want the percentage of oxygen in the system to be above 35%, and since the carrier gas is 100% oxygen, the
system will eventually reach a value well in excess of 90%.
Q: How long does it take to reach this level?
A: There is not a simple answer to this question as many factors are involved. This article will set out to explain the operation of the circle circuit and suggest ways that the denitrogenation period can be minimised.
In many practices, since the oxygen levels are not being measured, an extended time for denitrogenation is allowed. This can often be between 10 and 15 minutes. As denitrogenation is associated with high usage of oxygen, and therefore anaesthetic agent, this is costly in terms of both the environment and the purse. With simple monitoring equipment it is possible to reduce this to around 5 minutes.
Since there are many different circles available, this article will provide facts and figures relating to the Burtons small animal CycloFlo circle, for which all the data is readily available and is shown in figure 1.

Figure 1: The Burtons small animal Cyclo-Flo Circle Circuit V2
This system has a canister volume of 1800mls, a variable relief APL valve and is suitable for animals from 7kg to 150kg. When filled with soda-lime the effective volume is reduced to 900mls. If used with a 5.0L reservoir bag and 1.8m, 15mm patient hoses, the total volume of the system is about 4.5L.
Q: How can the system volume be 4.5L, when there is a 5L reservoir bag?
A: Reservoir bags hang down and tend to be almost empty unless gas is forced into them. Most reservoir bags need to fill to approximately 50-60% of their volume before the pressure in them is sufficient to open the APL valve [5]. So, for a 5L bag, the volume in the circuit and in use is approximately 2.5L.
For this example and for others in this article we will assume the following patient details:
- Weight: 20kg
- Tidal Volume: 200mls (0.2L)
- Functional Residual Capacity: 800mls (0.8L)
- Respiratory Rate: 15 Breaths per minute
Using simulation and patient modelling it is possible to accurately predict the time it takes to reach a certain oxygen level in the circuit based on the patient's breathing rate, volume and on the incoming fresh gas flow rate. This model has been designed and produced by the author and is used for both oxygen, agent and CO2 level prediction within various circuits. At the moment these documents and programs are part of Burtons internal material and as such are not available for general release. However, the approach for oxygen and agent prediction is similar in principle to the model used by Mapleson in his 1998 paper on “The theoretical ideal fresh-gas flow sequence at the start of low-flow anaesthesia” [6]. In the Burtons model the uptake of agent istaken into account depending on its solubility and this is fed back into the modelling algorithm. Metabolised oxygen is also accounted for, and the model includes the fresh gas flow, canister volume, patient tubing, reservoir bag and patient lungs, which are themselves split into Tidal volume and FRC compartments.
The circle system can be considered to have two parts. One part is the patient, and the other is the rest of the anaesthetic circuit. Since they are both connected, their combined volume must undergo denitrogenation, which in our example is 4.0L + 0.2L + 0.8L = 5.0L.
There is one other point to consider. Take a look at Figure 2, which shows a stylised circle circuit. In most circle circuits because of the one-way valves, there is no flow around the circuit unless the patient is breathing, and so incoming fresh gas is voided through the APL valve. Consequently, the patient and breathing tubes do not denitrogenate. The patient must therefore be breathing regularly in order to circulate the gas sufficiently to achieve denitrogenation. Therefore, if your patient is not breathing very well following initial connection to the circle circuit, then denitrogenation will take much longer than expected. During denitrogenation, the FGF is usually set to a value much higher than is used during the maintenance phase. As explained above, this means that the amount of agent used in this phase is quite high (more later).

Figure 2: Only the patient's breathing efforts cause gas to circulate in the system
Q: How long does denitrogenation take?
A: This depends on the patient size and the volume of the anaesthetic circuit.
To reduce the time to denitrogenate, the circuit volume should be as small as possible. Use smooth bore 15mm patient hoses on patients under 40kg. Use an appropriately sized reservoir bag, where the bag size is equal to 6 times the patient’s tidal volume [7]. These will all help, but in reality, the process of denitrogenation does not take very long. For our 20kg patient and the CycloFlo circuit at 4L/min FGF, it will take around 2 minutes to reach 80% oxygen and it will take about 4 minutes to
fully denitrogenate. The modelled graph in figure 3 shows the process.

Figure 3: Simulated oxygen levels in a circuit during denitrogenation
There are a couple of things to note about this graph. Firstly, the inspired oxygen level never reaches 100% and secondly, the expired oxygen level is always less than the inspired. The expired oxygen level is less than the inspired due to the metabolic consumption of oxygen by the patient. Because this level is less than the incoming fresh gas, it will always dilute the incoming gas, so the inspired level of oxygen will always be less than that provided by the fresh gas. Also, remember that oxygen concentrators and generators may produce an oxygen value of 90-95%, in which case the maximum circuit level will be below 90%. This is OK for nearly all clinical cases. Only those extremely critical cases that have severe lung pathology will require circuit oxygen levels of 90% or more. Expired oxygen levels are typically around 4-5% less than inspired values due to the take up and use of oxygen.
The same setup was used in a real circuit using an ICON oxygen analyser [8], and produced the graph shown in figure 4 below.

Figure 4: Oxygen levels in a circle circuit during denitrogenation
The results are very similar to that predicted by the model. At a flow rate of 4L/min denitrogenation is complete after 4 minutes and oxygen levels reach 80% in just under 2 minutes, confirming the validity of the computer modelling and emphasising how rapid the denitrogenation period can be.
Q: Is it necessary to maintain the higher flow of 4L/min until the oxygen level is at or near 100%?
A: No. Due to the nature of the uptake, it will take a significant time to reach the final level. Once the oxygen level reaches 80%, the FGF can be reduced to 1.0L/min. The percentage oxygen will continue to rise even at this lower level.
Q: Why 80%?
A: To answer this fully, we need to look at something called the Alveolar Gas Equation, which calculates the partial pressure of oxygen in the alveoli based on the composition of the gas and the amount of carbon dioxide present.
Alveolar Gas Equation:
PAO2 = (760-47) x
FiO2 – (PACO2)/0.8
Here, PAO2 is the partial pressure of oxygen in the Alveoli, PACO2 is the partial pressure of CO2 in the Alveoli and FiO2 is the inspired fraction of oxygen.
In this article we needn’t go too deeply into this equation, but we can simply use it to calculate the partial pressure in the alveoli. For example, in normal room air, with an FiO2 of 0.21, a patient with an endtidal CO2 of 40mmHg will have a PAO2 of (713x0.21) -(40/8) = 99.73 mmHg, or approximately 100mmHg. This is the level expected in a healthy lung for an animal breathing room air. Previously it was mentioned that a level of 35% oxygen is sufficient to prevent hypoxia in a spontaneously ventilating animal. Using a value of 0.35 for the FiO2, produces a value of 306.5mmHg for the PAO2.
So, in all our patients we want to be comfortably above this value of around 300mmHg. With an inspired oxygen percentage of 80% (FiO2=0.8) the PAO2 is 520mmHg, which in a healthy spontaneously breathing animal is more than enough to guarantee full oxygen saturation, with plenty of reserve.
From the graphs above it will be observed that it takes as long to go from 80% to 90% as it does to go from 21% to 80%. Since 80% ensures haemoglobin saturation and since this value will rise even after the FGF is reduced, this is a safe target to achieve before turning down the FGF.
Q: If the circle circuit has just been used on another patient, will this change the denitrogenation time?
A: Yes. If the circle circuit is already full of a high concentration of oxygen, then denitrogenation of the patient is all that is required and therefore this will be substantially quicker. With the patient model above, the time for oxygen levels to reach 90% in the patient was decreased to 2 minutes at 4L/ min if the circle circuit was already full of 80% oxygen.
Q: The above modelling and measurements are very nice to see and demonstrate or suggest the time taken for that particular patient but how can you do this in practice?
A: Some multi-parameters have an oxygen analyser that is part of the breath analyser that also shows CO2 and sometimes agent. If that is the case, use the inspired oxygen levels shown on the screen to guide you. This is usually shown as FiO2 and is given as a fraction, rather than a percentage, so you would look for an FiO2 value of 0.8 (80%) before you reduced the FGF. If your multi-parameter doesn’t show FiO2 values, then you can buy stand-alone oxygen analysers, such as the ICON analyser [8].
This analyser costs around £300 and sits in the anaesthetic circuit on the To-Patient port of the circle and shows the oxygen as a percentage value. As a bonus the ICON analyser (figure 5: pictured below) can also be used to monitor oxygen levels in oxygen cages or the output from your oxygen concentrator.
![]() However, denitrogenation is not the only concern during the initial period of anaesthesia. We need to consider the effect of gas flow on delivered agent levels and the time it will take to reach sufficient agent levels to keep the patient asleep. Because the agent is carried in the oxygen supplied to the circuit it is inevitably tied up with the way oxygen is delivered, which is why we have concentrated on oxygen first.
However, denitrogenation is not the only concern during the initial period of anaesthesia. We need to consider the effect of gas flow on delivered agent levels and the time it will take to reach sufficient agent levels to keep the patient asleep. Because the agent is carried in the oxygen supplied to the circuit it is inevitably tied up with the way oxygen is delivered, which is why we have concentrated on oxygen first.
Figure 5: The in-circuit oxygen analyser, ICON
Anaesthetic Agent levels in the circuit and the patient
The situation with a volatile agent is slightly different from oxygen, because in this case we are much more interested in the expired value of agent than the inspired value.
The inspired value simply shows how much agent is in the anaesthetic circuit, not how much is in the patient. The expired value, on the other hand, shows how much agent has been taken up by the patient from the lungs and into the blood. Agent uptake can only occur down a diffusion gradient, meaning that as long as there is less agent in the blood than in the lungs, agent will move across into the blood, reducing the amount in the lungs, so on expiration the expired value will be less than the inspired value. Once the patient’s blood has reached the same level as the inspired level, the expired value will be the same as the inspired value. It is for this reason that we monitor the expired value.
Q: What is the desired agent level?
A: This does depend on a number of factors, such as the pre-med used, the health of the patient and of course the agent used. For a healthy patient the target concentration is just above the MAC (Minimum Alveolar Concentration) level for that agent. This is summarised in the below table.
| ISO % | SEVO % | DES % | |
| CAT | 1.6 | 3.1 | 10 |
| DOG | 1.3 | 2.4 | 10 |
At the MAC level 50% of patients will not respond to a painful surgical stimulus. This does of course mean that 50% of patients may respond, so the MAC is only a guide. With Isoflurane, a surgical plane of anaesthesia is usually obtained with 1.3 to 1.5 times MAC.
Because the agent has to be taken up by the blood of the patient, there is a time delay between the rising levels of agent in the circle and the expired levels from the patient.
There is also a delay in obtaining MAC levels in the circle circuit due to the time it takes for the agent to circulate and mix. This leads to a common situation where the inspired agent level by the patient is substantially below the vaporiser setting. Incoming gas from the anaesthetic machine is diluted by the volume of gas in the circle canister, reservoir bag and patient tubing. There is further dilution in the lungs of the patient and loss of agent by patient uptake, such that the initially expired gas is very low in agent. This expired gas goes back to the circle canister and dilutes the incoming fresh gas, keeping the inspired gas agent level low.
The process of obtaining the required agent levels in the circuit can be hastened by increasing the FGF and by ensuring that the patient is maintaining a normal minute volume ventilation. This is also at the start of the anaesthetic and ties in with the increased FGF required for denitrogenation.
To understand how the agent levels change at the beginning of an anaesthetic, the situation has been modelled using the computer model and the same animal parameters as before and is shown in figure 6 below. The vaporiser was set at 2.0% (1.5 x MAC) and the FGF was 4L/min. It takes approximately 4 minutes for the expired agent level to reach a value of 1.3% or MAC.

Figure 6: Inspired & Expired Agent levels in a Circle Circuit
Q: How can I assess the expired agent level?
A: If your multi-parameter supports agent monitoring, then you can use the values shown on the screen. These are typically shown as Fi (inspired) and Fe (expired) values. If your multi-parameter cannot monitor agent levels, then you need to use standard monitoring techniques: jaw tone, pupillary reflex, ear flick etc, in the same manner as usual. Having looked at the behaviour of both oxygen and anaesthetic agent levels in the circuit during the initial high fresh gas flow phase of the anaesthetic, it can be seen that for a 20kg patient, running the system at 4L/min with 100% oxygen will achieve the required denitrogenation and expired patient agent levels in around 5 minutes. The
oxygen levels can be assessed using an oxygen analyser at which point the FGF can be reduced to maintenance levels.
Q: What is the preferred oxygen maintenance level?
The metabolic requirement for a 20kg dog is quite low at around 60-100 ml per minute,
so in theory this is all the oxygen flow that is required. However, this value is lower than the sidestream rate on most capnographs, does not allow for circuit leaks and will make the circuit response time to changes in anaesthetic levels extremely long. In addition most vaporisers will not run accurately at this level, so for low-flow levels of anaesthesia it suggested that the fresh gas flow be reduced to somewhere between 1.0 and 0.5L/min. Remember that even though the FGF has been turned down, agent continues to be delivered at the vaporiser setting, and careful monitoring of the patient is required.
Q: Will the lower FGF affect the soda-lime usage?
A: Yes. Because more of the exhaled gas is passing through the soda-lime and back to the patient, sodalime usage will increase when the FGF is reduced. The usage of soda-lime is an important point because with low-flow anaesthesia the sodalime will need changing more frequently. This is a very difficult item to quantify because 1 hour operating with a German Shepherd will use more soda lime than 1 hour operating with a Jack Russel. There will however be a noticeable difference in the consumption of soda-lime and it will be necessary to change the soda-lime more often.
Q: How long between seeing an initial increase in the inspired CO2 to needing to change the soda-lime?
A: Once there is an increase in the inspired CO2, the sodalime should be changed, but what concerns people is, do they have enough time to finish their operation? This will of course depend on the size of the soda-lime canister but as a guide, the Burtons CycloFlo unit will support about 20
minutes of continued use with a 20kg dog with a FGF rate of 0.5L/min before the inspired CO2 rises above 5mm Hg. This will be less with a bigger dog and longer with cats.
Q: If the soda-lime usage goes up, doesn’t that negate the benefit of conserving agent, and doesn’t it also increase environmental waste?
A: These are very good questions. With regard to the first question, the cost benefits are clear. Reducing the FGF to low flow levels, results in an increase cost in soda-lime of about 10p/hour. The cost savings for agent (Isoflurane) are about £1/hour. Additionally, and that is what this article is about, using low-flow anaesthesia markedly improves the sustainability of veterinary practice. The
second point is important too. Soda-lime goes to landfill. However, the environmental impact of agent release is seen for years, whereas soda-lime does not have that prolonged environmental
impact, and whatever we may think about landfill it is not as bad as the effect of greenhouse gas emissions.
Minimising consumption in non-rebreathing circuits
Having looked at how to minimise agent consumption in circle circuits, we can now look at agent use in nonrebreathing circuits. There are potential savings to be made in terms of agent use because of their inherent high fresh gas flow rates, particularly in those circuits with a high circuit factor.
In the Mapleson D, E and F circuits (Bain, T-piece) the Fresh Gas Flow rates are set in accordance with the patient’s minute volume and a circuit factor. Typically, this circuit factor has a value of between 2.5 and 3.0, so if a patient has a minute volume of 1L/min, the FGF will be set at 2.5 to
3L/min. Typically, this FGF will remain the same for the entire duration of the procedure. However, the FGF can often be substantially reduced if the pattern of the patient’s breathing changes. To understand why, we need to look at the origin of the circuit factor values. The circuit factor values are based on the ratio of inspiratory time to expiratory time. With an I:E ratio of 1:2, the circuit factor is 3.0 and with an I:E ratio of 1:1.5, the circuit factor is 2.5. So, there is an association between the I:E ratio and the circuit factor. However, because the breathing pattern of a patient can change during a procedure, so can the circuit factor for that patient, especially if the patient has an expiratory pause. When a patient is initially induced there has been a period of excitement for the animal and the respiratory rate is often elevated and remains so for the initial period of the anaesthetic. Once a stable plane of anaesthesia has been reached, the breathing rate often decreases to the extent that a noticeable expiratory pause is evident, i.e. a clear resting of the chest at the end of expiration and before the start of inspiration. Identifying the expiratory pause is key to being able to reduce the FGF to the patient. As soon as an expiratory pause is evident, the circuit factor reduces. Even a 1 second expiratory pause can reduce the circuit factor from 3.0 to 2.0, or from 2.5 to 1.75 and longer pauses will reduce it further, although it would rarely fall below 1.5. Even so, a patient whose circuit factor reduces from 3.0 to 1.5 can have their FGF reduced by 50%.
Q: Does the effect of an expiratory pause apply to all non-rebreathing circuits?
A: Yes. If an expiratory pause is identified, then the FGF can be reduced in any of the non-rebreathing circuits. However, the appearance of the capnogram is different in Mapleson D, E and F circuits compared to Mapleson A circuits (Lack, Mini-Lack, Magill).
Q: I can identify the breathing pattern that indicates an expiratory pause, but how do I know how much the circuit factor has changed?
A: It is not easy to re-calculate the new circuit factor, but by identifying the expiratory pause, it suggests that the FGF can be reduced. Next, we will look at how this is done in practice.
How to reduce the FGF and identify rebreathing
The capnogram seen with rebreathing from a Mapleson D, E and F is different from the capnogram seen with rebreathing from a Mapleson A, or with a circle circuit, so it is important to understand the changes to expect.
Rebreathing in a Mapleson D, E or F circuit
In the Mapleson D, E and F circuits the expiratory limb can be a reservoir for fresh gas, but this can only occur during an expiratory pause. In the expiratory pause the patient is neither taking in gas, nor expelling it, so the fresh gas flushes the alveolar gas down the expiratory limb starting from the patient mouthpiece. When the patient takes the next breath it can draw this fresh gas back from the expiratory limb, which reduces the demand on the FGF. If too much gas is inspired from the expiratory limb, then previously expired alveolar gas will be inspired, and rebreathing will occur. This will be seen on the capnograph as an inspired amount, i.e. the trace is raised above the baseline. If all of the fresh gas in the expiratory limb is not inspired, then this is wasted and the FGF is unnecessarily high. By observing the capnograph, the FGF can be tuned to the patient’s current requirements. What the capnogram will look like will depend on the presence and duration of the expiratory pause.
Insufficient FGF Capnograph Examples
Insufficient FGF and no expiratory pause
If there is no expiratory pause, then the capnogram with insufficient FGF will have the following appearance:

No expiratory pause. Correct gas flow.

No expiratory pause. FGF just below requirement.
No expiratory pause. Moderate insufficient FGF.

No expiratory pause. Marked insufficient FGF.
Insufficient FGF with an expiratory pause
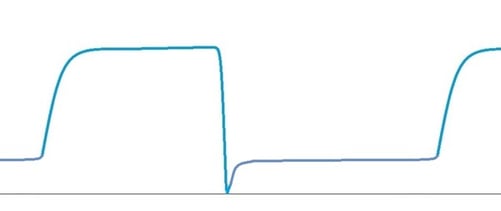
The following capnograms show the various appearances of the capnogram trace in a Mapleson D/E circuit as the expiratory pause increases, in a circuit with insufficient FGF.

Normal Capnogram, sufficient FGF. No expiratory pause.

Short expiratory pause. Insufficient FGF.

Significant expiratory pause. Insufficient FGF.

Significant expiratory pause. FGF just below minimum requirement.
Normal Capnogram, Sufficient FGF

It should be noted that the appearance of the capnogram can vary markedly depending on the nature of the inspired breath. If inspiration is deep and rapid, then the slope of Phase 0 will be steeper than if the inspiration is long and slow. There is also a slight difference in appearance between sidestream and mainstream devices. However, the stylised diagrams show the general appearance and what to expect in a Mapleson D, E or F circuit.
Now that the appearance of the capnogram under different conditions is understood, we can consider how to use this knowledge to minimise our FGF.
The general approach to a case using a Mapleson D, E or F should be as follows:
- Calculate the minimum FGF based on the patient’s Minute Volume (MV).
- Set the FGF on the anaesthetic machine to 2.5 – 3.0 x MV.
- After the initial period of anaesthesia, observe the patient’s breathing pattern.
- If the character of breathing has changed, an attempt can be made to reduce the FGF.
- Observe the capnogram and slowly reduce the FGF, watching for signs of rebreathing, as indicated by a trace that sits above the base-line.
- Once evidence of rebreathing is observed, increase the FGF slightly until a normal capnogram is obtained.
- Be prepared to adjust the FGF if the breathing pattern of the patient changes and evidence of rebreathing appears on the monitor. This will generally be the case during lightening of the anaesthetic.
Rebreathing in a Mapleson A Circuit & Minimising FGF
The appearance of rebreathing in a Mapleson A circuit is different to that seen in a Mapleson D circuit. There are two main changes during rebreathing: a change in the slope of Phase 0 and elongation of phase 3. In this circuit, it is the inspiratory limb that acts as the temporary reservoir for fresh gas, not the expiratory limb.
When the patient exhales in a Mapleson A circuit, the initial portion of the breath containing the dead space gas passes back down the inspiratory limb towards the bag helping to fill the bag, along with the incoming FGF. Once the bag is full, the pressure rises, and all further exhaled gas passes down the expiratory limb and out through the now-open APL valve. At the same time the FGF
now pushes the dead space gas back towards the patient. I the FGF is correct, then at the point of the next inspiration, the patient can inhale the dead space gas from the inspiratory limb, thus reducing the FGF requirement. If the FGF is too low, then the dead space gas will be too far down the inspiratory limb at the point of inspiration and so CO2-rich alveolar gas will be inhaled from the inspiratory limb. If the FGF is too high, then the dead space gas will be washed out along the expiratory limb before inspiration begins and so be lost. When the FGF is correct, all the dead space gas will be recaptured and the circuit factor will be less than 1, typically 0.75 – 0.8 in dogs and cats. Any expiratory pause will mean that the FGF can be reduced, as during the pause period the dead space gas continues to be pushed back along the inspiratory limb towards the patient and may be lost if the FGF is too high.
Q: If the patient is breathing in the same breath that it breathed out, how will this appear on the capnograph?
A: The signs are more subtle than with the Mapleson D or E circuit, but the first sign will be a change in the slope of Phase 0. The capnograph may well still indicate an FiCO2 of zero, but if Phase 0 is not a very sudden drop to zero, then there will already be rebreathing.
What is less obvious in this circuit is that the length of Phase 3 will appear to lengthen if either there is rebreathing, an expiratory pause or both, so rebreathing can be difficult to clearly identify on a Mapleson A circuit. When adjusting the FGF on a Mapleson A circuit, as with a Mapleson D circuit, the aim is to obtain a rapid fall in Phase 0 and see if the width of the capnogram reduces.
A capnogram series from a Mapleson A circuit, with reducing FGF rate

Normal capnogram. Correct FGF

Rebreathing. Insufficient FGF. Note the elongated phase 3 due to rebreathing and the slope in phase 0.

Rebreathing. Insufficient FGF. Note the elongated phase 3 due to rebreathing and the slope in phase 0.
Summary
Q: In summary, what is the best way to reduce FGF and thereby agent use in non-rebreathing circuits?
A: Use the Capnograph as the guide to rebreathing. Be aware of the different appearances of rebreathing in different circuits and reduce the FGF, looking for signs of rebreathing. This can be especially beneficial in patients that have a distinct expiratory pause.
Q: If the patient is not showing an expiratory pause, are there any benefits to reducing the FGF?
A: It is quite possible that the calculated FGF is either too high or too low, so adjusting the FGF at the start of the anaesthetic for optimum levels is always a good idea, regardless of the presence of an expiratory pause.
The procedure for minimising FGF in a Mapleson A circuit is similar to the method used in the Mapleson D or E circuits:
- Calculate the minimum FGF based on the patient’s Minute Volume (MV).
- Set the FGF on the anaesthetic machine to 1.0 x MV.
- After the initial period of anaesthesia, observe the patient’s breathing pattern.
- If the character of breathing has changed, an attempt can be made to reduce the FGF.
- Observe the capnogram and slowly reduce the FGF, watching for signs of rebreathing, either as a change in the slope of Phase 0, or in the length of Phase 3.
- Once evidence of rebreathing is observed, increase the FGF slightly until a normal capnogram is obtained.
- Be prepared to adjust the FGF if the breathing pattern of the patient changes and evidence of rebreathing appears on the monitor. This will generally be the case during lightening of the anaesthetic.
Conclusion
There are several opportunities in general practice to reduce the amount of agent and oxygen used during anaesthesia. The savings in both environmental and financial costs are potentially significant, and with a little investment in some extra monitoring equipment, or even use of existing
equipment, significant savings can be made. Simply using an oxygen monitor in a circle circuit could save up to an hour a day at 4L/ min compared to 1.0L or 0.5L.min, because the denitrogenation time is not fixed at 10 or 15 minutes as is routinely the case but may be as short as 2-3 minutes if the circuit is already full of a high percentage of oxygen. An hour at 4L/min compared
to 0.5L/min will reduce agent costs from approximately £3.96 to £0.49 for that hour, for our 20kg example dog. Careful observation and interpretation of the capnograph will also help to set the appropriate fresh gas flow for a patient on a nonrebreathing system. All of the information for this is already available using a standard capnograph, so nearly every practice in the country has the ability to optimise their agent and oxygen usage.
This article highlighted the procedures used to reduce FGF to a minimum in rebreathing and nonrebreathing circuits.
The take-home points are:
- Volatile agents are Greenhouse Gases (GHG) and their release into the environment has a large impact on the sustainability of veterinary practice and the planet.
- Oxygen and agent use during denitrogenation can be minimised by using simple monitoring devices.
- Denitrogenation can be quite quick particularly if the circle system is already full of high levels of oxygen.
- Agent and oxygen use in nonrebreathing circuits can be minimised by careful control of the fresh gas flow rate.
- The changes seen in the capnogram with rebreathing vary with different circuits and under different conditions.
- The FGF requirements of a nonrebreathing circuit change during the course of the anaesthetic.
- Not all rebreathing will lead to an inspired value being shown on the capnograph, so attention to the shape of the capnogram is important.
References
[1]. Varughese S, Ahmed R. Environmental and Occupational Considerations of Anesthesia:
A Narrative Review and Update. Anesth Analg. 2021 Oct 1;133(4):826-835. doi: 10.1213/ANE.0000000000005504. PMID: 33857027; PMCID: PMC8415729.
[2]. Yasny JS, White J. Environmental implications of anesthetic gases. Anesth Prog. 2012 Winter;59(4):154-8. doi: 10.2344/00033006-59.4.154. PMID: 23241038; PMCID: PMC3522493.
[3] SageTech Medical. Suite F4, Westfield Business Park, Long Rd, Paignton TQ4 7AU
[4] Nunns Respiratory Physiology. Seventh Edition, Ch11 , Pg 181
[5] Burtons internal paper: Breathing bag behaviour related to filling pressure. K Simpson, 2023
[6] Mapleson Anaesthesia 1998,Vol 53, Pages 264-272
[7] Burtons internal paper: Reservoir bag selection size. K Simpson 2023
[8] ICON Analyser (SKU:VSL-ICON). Burtons Medical Equipment, Marden, Kent.